RRC Polytech Water Footprint Assessment
At RRC Polytech, water isn’t just a utility, it’s a responsibility. We adopt a proactive approach to monitoring, managing, and reducing our water footprint across all campuses. As outlined in our Sustainability Strategy and Land Acknowledgement, RRC Polytech recognizes the sacred importance of water, which for our Winnipeg campuses originates from Shoal Lake 40 First Nation in Treaty 3 Territory. The institution also recognizes the Treaty Territories that provide the electricity powering our personal and professional lives. Conservation, in this context, is both a practical and deeply respectful commitment.
To honour this commitment to water stewardship, RRC Polytech has undertaken a water footprint assessment to reveal usage patterns, costs, and opportunities for conservation. This assessment includes both our direct water usage, as well as our indirect water usage consumed during the production of natural gas, electricity, paper and electronics used in our operations.
Methodology
At RRC Polytech, we’ve developed a water calculation approach that helps us better understand and communicate how water is used across our operations and supply chain. Our method builds on key principles from the internationally recognized water footprint framework created by the Water Footprint Network, as detailed in The Water Footprint Assessment Manual (2011). For this evaluation, we’ve compared data from 2024 against a baseline year of 2019 to understand how our water impact has evolved.
It’s important to note that this assessment isn’t fully comprehensive. It doesn’t include certain products we consume, like food served in our cafeteria. Omitting these items means our reported footprint is likely underestimated.
| Reporting Category | Input | Methodology | Notes and Assumptions | References |
| City water consumption | Meter readings from all 4 campuses | Usage data from utility bills are directly uploaded to Energy Star Portfolio Manager, and can be visualized as needed. | Reported data is based on water withdrawn from the City for use in our operations. This does not include water from any other sources such as rain. Because all discharges and/or evaporation rates aren’t tracked, all water in direct operations is assumed to be consumed. This analysis therefore does not take into account green water footprint and grey water footprint, only blue water footprint. | Not Applicable |
| Electricity used in operations | Meter readings from all 4 campuses Water consumption coefficient | Annual electricity usage was multiplied by the water consumption coefficient (13.12 m³/MWh). All electricity used is reported in MWh. Indirect water consumption (m3) = Annual total electricity consumption from operations (MWh) * Water consumption factor (m3/MWh) | Because our electricity is mainly hydroelectricity, we used the water coefficient for hydroelectricity. | Ali, B. (2018). Forecasting model for water-energy nexus in Alberta, Canada. Water-Energy Nexus, 1(2), 104-115. |
| Natural gas used in operations | Meter readings from all 4 campuses Water consumption coefficient | Annual natural gas usage was multiplied by the water consumption coefficients of the two main pathways. All natural gas used is reported in m³. Indirect water consumption (m³) = (Annual total natural gas consumption produced from Petroleum-oil sands-extraction-surface-mining (m³) * Water consumption factor (m3/m³) of relevant pathway) + (Annual total natural gas consumption produced from the conventional pathway (m³) * Water consumption factor (m3/m³) of relevant pathway). The natural gas quantities consumed under each pathway was calculated as a ratio of the total natural gas consumed by the college. | RRC Polytech assumes that the technology used to generate its purchased natural gas consists of a mix of pathways, with Petroleum-oil sands-extraction-surface-mining as the most common pathway used, followed by the conventional pathway. RRC Polytech has taken an average of the different pathways’ water consumption coefficients to calculate this mix. | Ali, B. (2018). Forecasting model for water-energy nexus in Alberta, Canada. Water-Energy Nexus, 1(2), 104-115. CER – Canada’s Pipeline System 2021 – Natural Gas Pipeline Transportation System |
| Paper consumed | Quantity of paper purchased Water consumption coefficient | The total quantity of paper purchased for the year was multiplied by a water consumption coefficient of 0.0075m³ for each A4 sheet. | The water consumption coefficient was derived from global average estimates. It is also assumed that all paper was produced using conventional methods. There was no distinction made between recycled and virgin paper. Lastly, the scope includes only the production phase, and not the end-of-life phase. | Van Oel, P. R., & Hoekstra, A. Y. (2010). The green and blue water footprint of paper products: Methodological considerations and quantification. |
| Electronics purchased | Quantity and type of electronics purchased Water consumption coefficient of each type | The water footprint was calculated by multiplying the quantity of each type of electronic device purchased by its respective water consumption coefficient. The coefficients/factors were derived from relevant LCA and manufacturer sustainability data. | All devices purchased were newly manufactured, not refurbished. The electronic devices were limited to desktops, laptops, tablets and monitors. The water consumption coefficients are based on average estimates and may vary depending on production location and company-specific practices. | Avani Sachin Kulkarni, ” Environment Protection and Sustainable IT” International Journal of Scientific Research in Computer Science, Engineering and Information Technology(IJSRCSEIT), ISSN : 2456-3307, Volume 9, Issue 7, pp.58-62, March-April-2023. Helen Burley, “The Land and water footprints of everyday products. Mind your step.” / Helen Burley Friends of the Earth Trust Friends of the Earth Trust 2015. – 44 p. http://library.unccd.int/Details/fullCatalogue/587 https://static.lenovo.com/jp/flash-media/ThinkCentre-X1-Water-Footprint-Declaration.pdf https://download-c1.huawei.com/download/downloadCenter?downloadId=85283&version=338971&siteCode=worldwide https://blogs.ifas.ufl.edu/sarasotaco/2025/01/13/water-footprint-in-the-home/ https://circularcomputing.com/news/carbon-footprint-laptop/ |
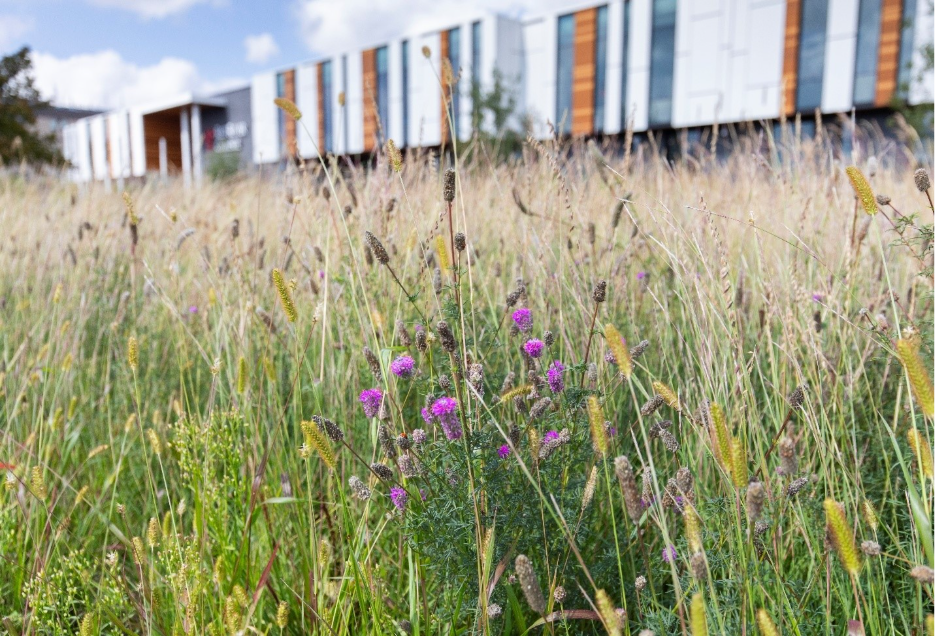
Our conservation efforts to date have included engaging strategic tools like ENERGY STAR® Portfolio Manager and data visualization platforms to analyze trends, increase transparency, and drive continuous improvement. Innovative conservation measures such as rainwater harvesting at Manitou a bi Bii dazigae, low-flow fixtures, green roofs, and drought-resistant landscaping, have supported direct water usage reductions, while initiatives like our Sustainable and Socially Responsible Procurement Policy support efforts to reduce our indirect water usage.
The results of our water footprint assessment indicate that both our conservation efforts have been working, and that we have further to go. While our direct water consumption grew slightly, from 78,260 m³ in 2019 to 84,964 m³ in 2024, during this time RRC Polytech had an increase in both floor space, and student enrollment. Our indirect water use has seen a reduction, partially influenced by reduced natural gas usage due to warmer than usual winters, but also due to building efficiency improvements and a massive reduction in paper usage. Thanks to our collective efforts, our total water footprint has decreased by more than 1.4 million cubic metres since 2019, a strong step forward in our sustainability journey.
| Reporting Category | Baseline Year: 2019 | Reporting Year: 2024 |
| City Water Consumption (m³) | 78,260.39 | 84,964.16 |
| Electricity Used (MWh) | 25,060.74 | 25,208.44 |
| Indirect Water Footprint from Electricity Use (m³) | 328,796.91 | 330,734.73 |
| Natural Gas Used (m³) | 4,420,345.41 | 3,442,400.79 |
| Indirect Water Footprint from Natural Gas Use | 7,031,537.95 | 5,475,900.54 |
| Paper Used (sheets) | 5,472,208 | 2,253,025 |
| Indirect Water Footprint from Paper Use (m³) | 41,041.56 | 16,897.69 |
| Electronics Purchased | 1241 | 2316 |
| Indirect Water Footprint from Electronics Purchased (m³) | 115,448.29 | 194,514.71 |
| Total Direct and Indirect Water Footprint (m³) | 7,595,085.10 | 6,103,011.83 |
| FTE Enrollment | 10,190.15 | 12,738.25 |
| Total Direct and Indirect Water Footprint per Capita (m³ per capita) | 745.34 | 479.11 |
| Gross Floor Area (m²) | 151,705.75 | 161,646.37 |
| Total Direct and Indirect Water Footprint per sqm (m³/m²/year) | 50.06 | 37.76 |
Looking ahead, we’re taking tangible steps to improve on these efforts by:
- Installing more metering and sub-metering systems to gain precise insights into water performance
- Establishing conservation targets tailored to each campus
- Identifying retrofit opportunities that enhance water-use efficiency
- Expanding the re-use of water and rainwater capture in daily operations
As we move forward, RRC Polytech remains committed to being a steward of sustainable water use, ensuring that every drop counts toward a healthier, more resilient future for our community and the environment.