Institutional Research

Staff Dashboard User Guide

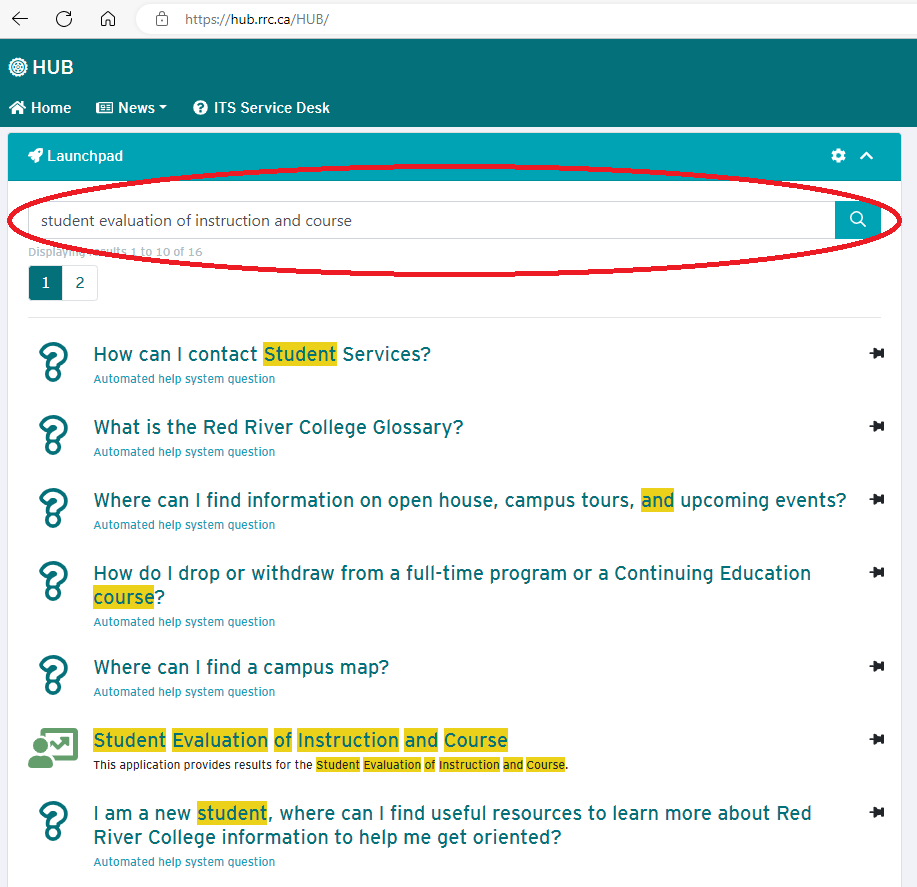
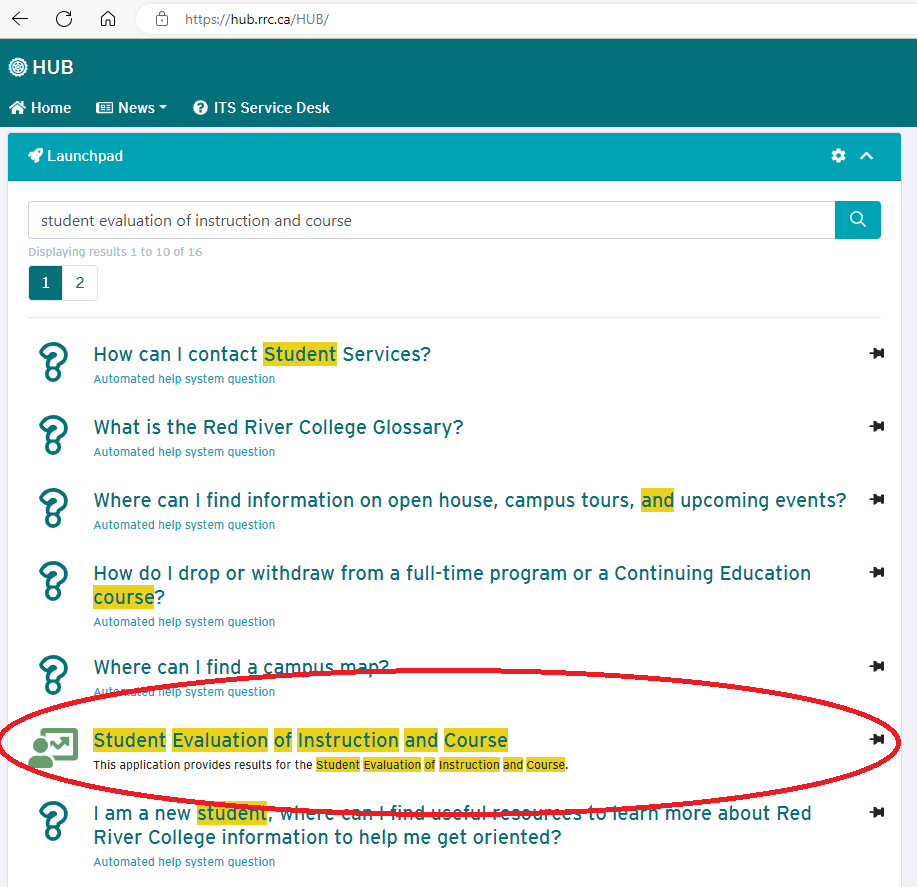
This guide is designed to assist the navigation of the Student Evaluation of Instruction and Course (SEI/C) Dashboard.

Logging In

  1. Log into your HUB account.
  2. Once you log in using your credentials for HUB, search for “Student Evaluation of Instruction and Course” in the search bar as shown in the image below.
  1. Click on the “Student Evaluation of Instruction and Course” widget to login to the dashboard.

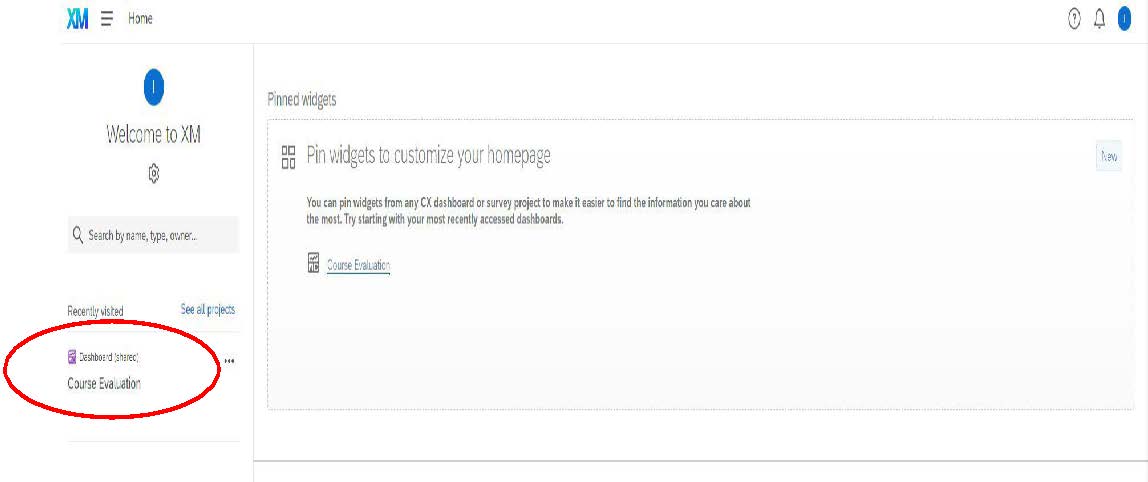
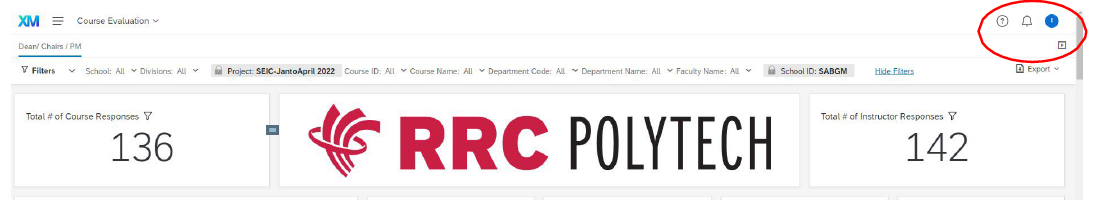
Tip: You can pin the evaluations widget by clicking on the pin button on the right side of the widget for easy access in the future.

Dashboard Homepage 

  1. Below is the Home page for the Dashboard that you can see when you login to the dashboard.
    1. Click on “Dashboard (shared) – Course Evaluation” to go to your dashboard.
  1. Alternatively, you may land directly in the projects section and can select “Course Evaluation” to access the dashboard. 

Inside the Dashboard

  1. A click on the “Course Evaluation” will take you to the dashboard. 

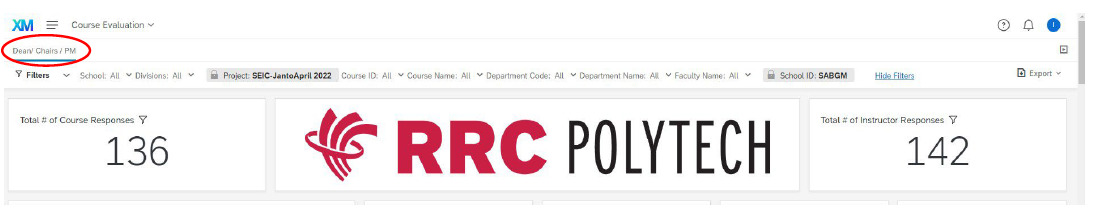
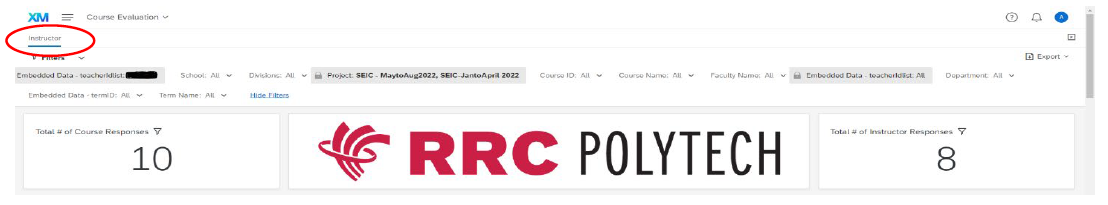
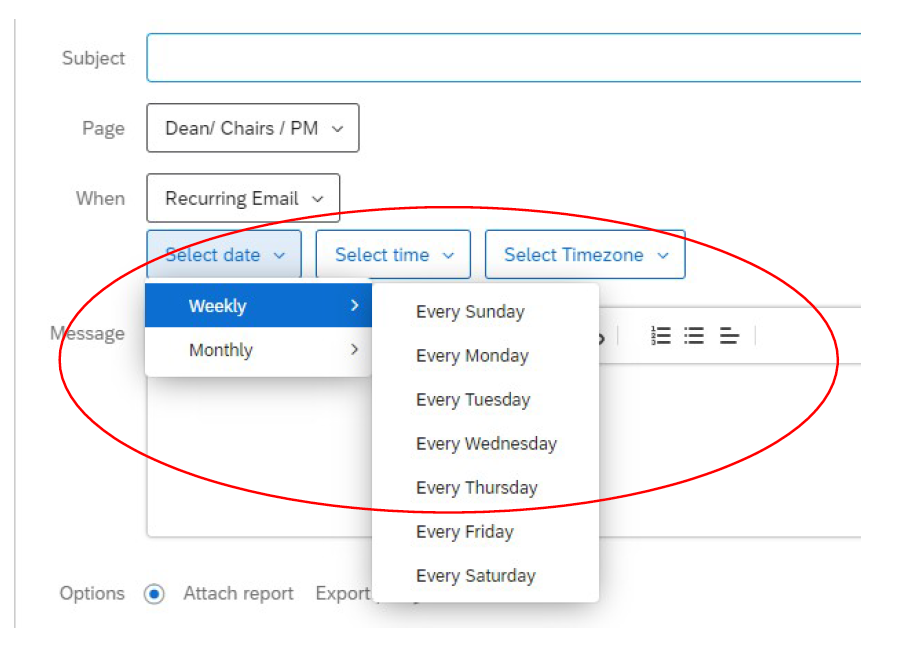
Note: Views from Dean/Chair/PM dashboard have been used throughout this guide for illustration. In your account, you will get views specific to your position(s). 

Basic Settings and Account Information 

  1. On the top right corner, click on the blue circle icon to go to your Account Settings. Under User Settings, you can change the setting for your account including password, time zone, language, etc.

Using the Filters

  1. The dashboard has filters that you can use to refine the presentation of data. 
    1. Under the Deans/Chairs/PM dashboard, the data is related to your Schools(s) and/or Division(s).
      • You can use the filters to drill-down for more detailed information related to your own School/Division using the Terms, Divisions, Courses, Departments, and Faculty filtering options. 
    2. Under the Instructor dashboard, the data is related to your courses.
      • You can use the filters to drill-down information related to your own courses using the Terms, Divisions, Courses, and Departments filtering options. 

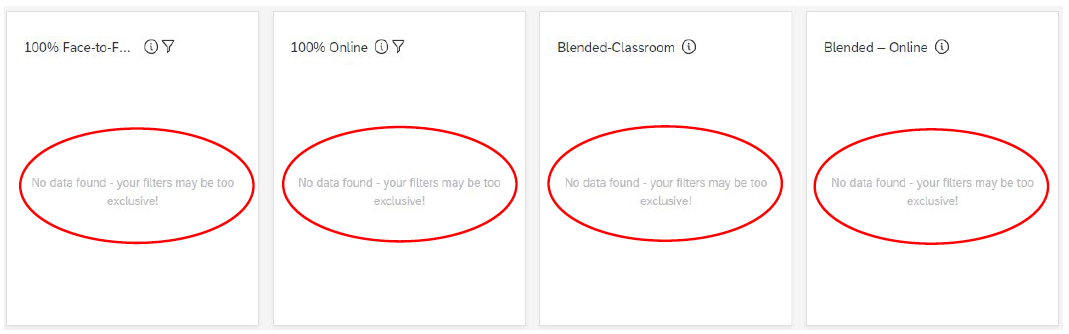
Tip: The filters work together and you can use multiple filters at once. However, you will need to reset them to proceed with a “new view”. The simplest way to reset is to select “ALL” for each filter that was used and start again with your new selections. If you are using more than one filter, and experience an unexpected result please double-check that your filters are reset as they may be incompatible (e.g., Department selection does not align with a Division selection).

Greyed and Locked Filters 

  1. Some filters are “greyed out/locked”. Filters showing a lock sign on the left side of the filter are static in order to display the appropriate data and are not available for filtering.

Examples

  • The Term filter will only present the data/reporting that is available/released. 
  • Deans will see information related to their School(s); Chairs will see information related to their Division(s), Instructors will see information related to their course(s). 

Hiding Filters 

  1. Clicking on the “Hide Filters” tab will hide the filters from the screen. To bring back the filters, simply click on the “Display Filters” tab. 

Using the Dashboard Widgets

  1. Following the filter at the top of the dashboard page are the widgets that show the “Total # of Course Responses” and “Total # of Instructor Responses”.
  1. The “Delivery model” widget shows responses in the form of a pie chart, followed by the breakdown of the delivery model into the choices for the delivery.
  1. If you hover the mouse over the chart/widget, you will see further details e.g., scale point, response percentage, response count etc.
  2. For each widget, by clicking on the “i” tab you will get more information about the question asked in the survey.

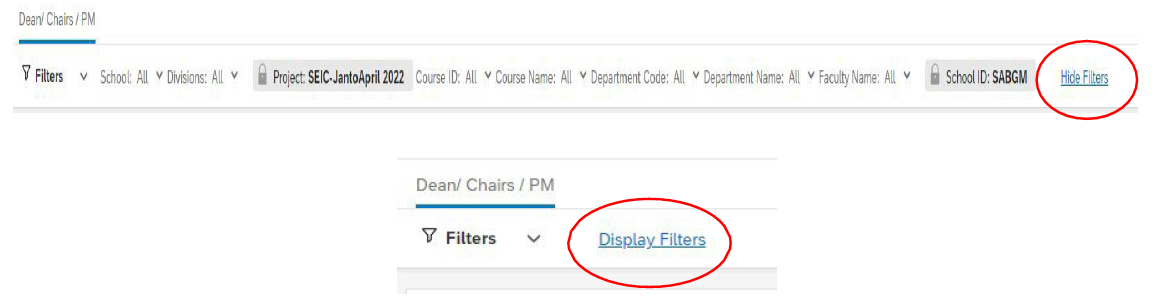
Caution: Do not change the filters on the widget(s).

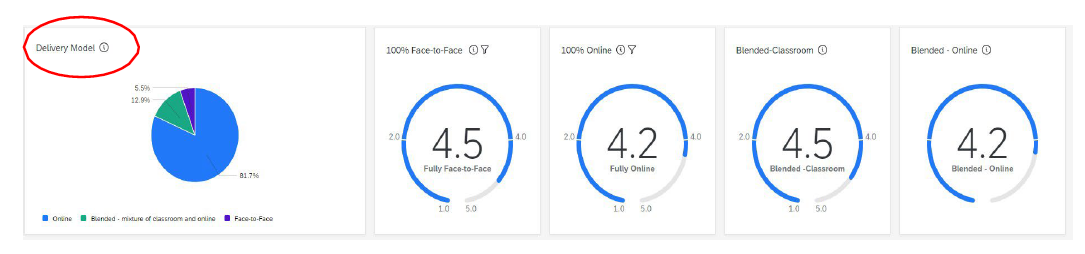
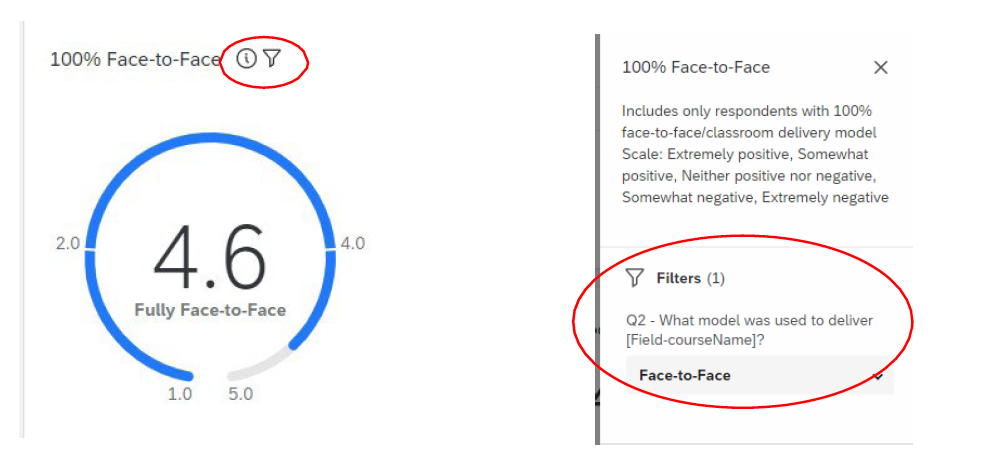
Some filters have widgets to represent data from the same question in various ways. While you can click on the “i” for more information, where the menu appears on the right-hand side for more information you do not want to change the filter as it will modify the information source. 

  1. If you see no data showing in the widgets that means there are less than 5 responses, too little data to show in the widget.

Exporting the Dashboard 

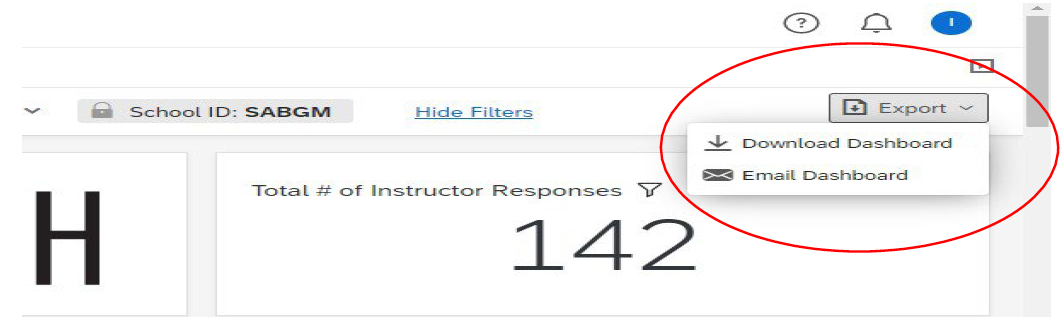
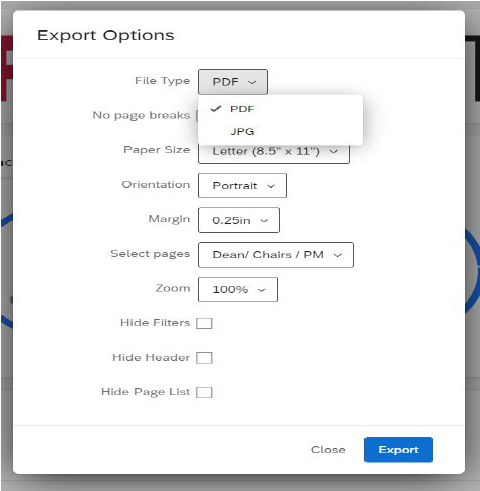
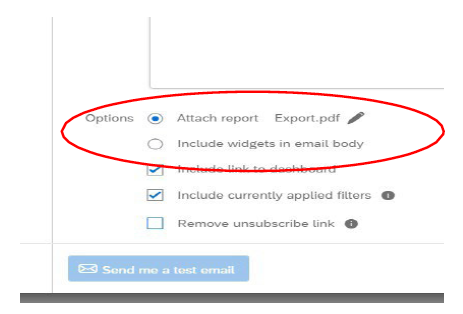
Note: Please use caution when exporting and storing any of the dashboard reports. The information in these reports is confidential and intended for your use only. This is particularly important for filtered reports and comment sections where confidentiality is extremely important. 

  1. On the top right corner click on the “Export” tab to display the drop-down menu showing the “Download Dashboard” and “Email Dashboard” tabs.
  1. By clicking on “Download Dashboard”, you will get the following window on the screen, and you will be able to choose from the available file types and other options, when you are done selecting the options, click on the “Export” tab at the bottom to download.
  1. Alternatively, you can click on the “Email Dashboard” to email the dashboard by providing the email address(es), name, subject and message (optional) in the “To”, “From”, “Subject” and “Message” field respectively. When the required fields are filled in with information, “Send Email” tab will turn dark blue in color. Then, click on the “Send Email” tab to send the dashboard in your inbox.
  1. Under “When” tab you have two options to send the dashboard in an email. Clicking on the “Email Now” tab will display two options: “Email Now” and “Recurring Email”. You can select either of these. Selecting the “Email Now” will send the email at the same time.
  1. If you select “Recurring Email”, you will get the following options to select the date and time for scheduling the email.
  1. When you select the “Recurring Email” instead of the “Email Now” option, you will get the “Schedule Email” tab at the bottom to schedule the email send out.
  1. There is an “Options” tab below the “Message” box. You can either send the dashboard report as an attachment or display the widgets in the email body by clicking on the radio button for either option.
  1. Next, there are three check boxes, you can check or uncheck any of these boxes depending on your requirement for the dashboard report.

Troubleshooting 

If you are experiencing issues or concerns with accessing your dashboard and/or the content of the dashboard that is not addressed in this user guide, and/or have concerns with data that you see in your dashboard, please contact IAP by emailing RRCSurveys@rrc.ca

RRC Polytech campuses are located on the lands of Anishinaabe, Ininiwak, Anishininew, Dakota, and Dené, and the National Homeland of the Red River Métis.

We recognize and honour Treaty 3 Territory Shoal Lake 40 First Nation, the source of Winnipeg’s clean drinking water. In addition, we acknowledge Treaty Territories which provide us with access to electricity we use in both our personal and professional lives.

Learn more ›